首先,在代码中引入 pprof 的方式非常简单,只要把下面这段代码放到 main 函数中即可
_ "net/http/pprof"

go func() {
		if err := http.ListenAndServe(":9090", nil); err != nil {
			panic(err)
		}
		os.Exit(0)
	}()
然后启动你的程序,再用以下这些命令去对应的端口做 profiling
// cpu profile 默认从当前开始收集 30s 的 cpu 使用情况,需要等待 30s
go tool pprof http://47.93.238.9:9090/debug/pprof/profile
# wait 120s
go tool pprof http://47.93.238.9:9090/debug/pprof/profile?seconds=120

// 以下 second 参数不起作用,因为采样是一瞬间完成的
go tool pprof http://47.93.238.9:9090/debug/pprof/heap
go tool pprof http://47.93.238.9:9090/debug/pprof/goroutine
go tool pprof http://47.93.238.9:9090/debug/pprof/block
go tool pprof http://47.93.238.9:9090/debug/pprof/mutex
还有一种是 import "runtime/pprof“的方式,这种不太常用,不在本文范围。
运行了 go tool pprof 命令以后,会进入到一个交互界面,
$ go tool pprof "http://localhost:9090/debug/pprof/goroutine"
Fetching profile over HTTP from http://localhost:9090/debug/pprof/goroutine

//出现以下内容,代表采样已经完成,可以查看了
Saved profile in /Users/xx/pprof/pprof.goroutine.001.pb.gz
File: xx
Type: goroutine
Time: Jul 18, 2021 at 4:55pm (PDT)
Entering interactive mode (type "help" for commands, "o" for options)
(pprof) quit
一旦进入了可交互模式后,代表采样已经完成,这时候可以
- 输入
svg > xxx.svg可以生成一个图片存下来,或者 - 输入 quit 退出,所有数据文件存在上面提到的目录下。
然后就是查看这个 perf data 了,用 go tool pprof data.pb.gz可以进入到一个命令行界面
(pprof) top
Showing nodes accounting for 5250ms, 50.72% of 10350ms total
Dropped 268 nodes (cum <= 51.75ms)
Showing top 10 nodes out of 231
      flat  flat%   sum%        cum   cum%
    1220ms 11.79% 11.79%     1990ms 19.23%  runtime.scanobject
    1080ms 10.43% 22.22%     1110ms 10.72%  syscall.Syscall
     590ms  5.70% 27.92%      590ms  5.70%  runtime.futex
     580ms  5.60% 33.53%      580ms  5.60%  runtime.memmove
     380ms  3.67% 37.20%      380ms  3.67%  runtime.memclrNoHeapPointers
     370ms  3.57% 40.77%      370ms  3.57%  runtime.procyield
     330ms  3.19% 43.96%      420ms  4.06%  runtime.findObject
     270ms  2.61% 46.57%     1750ms 16.91%  runtime.mallocgc
     220ms  2.13% 48.70%      240ms  2.32%  runtime.pageIndexOf (inline)
     210ms  2.03% 50.72%      210ms  2.03%  runtime.usleep
但是我更喜欢用这个命令
go tool pprof -http=:9091 pprof.goroutine.001.pb.gz
这样就可以直接在浏览器里面看图片了。这种方式提供了更加直观的多种视图。
总体来说使用 pprof 还是很简单方便的。
遇到的坑
下面来说说我遇到的坑,或者说是各种介绍 pprof 的文档、博客没有说清楚的地方。
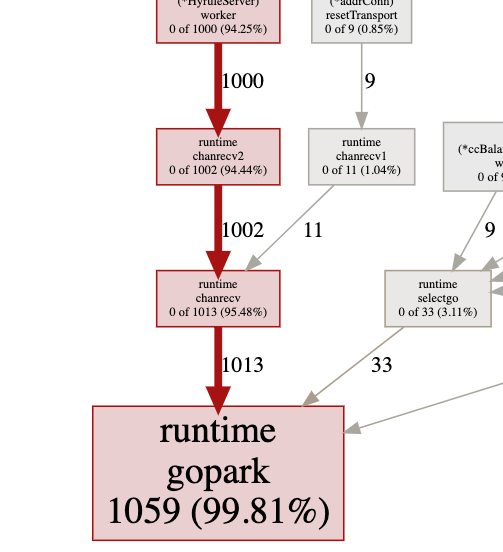
事情的起因是在一个函数中,我创建了 1000 个 worker() 函数的goroutine,但是在采样到了 goroutine.003.pb.gz 文件中,却一点都没有看到这些1000 个goroutine,甚至连叫 worker 函数的都没看到。
起初,我以为 pprof 的采样是选择一些cpu 高的goroutine,而像这 1000 个worker, 我只是创建了并没有运行,因此不会显示在最后的图中,但是越想越觉得不对。
后来才发现,像 goroutine,heap,block 这种都是在一瞬间采样就完成的,只有 profile ,go tool 命令才会卡在那里等待一段时间才显示交互界面。
怎么判断呢? 当我们指定 profile 时,(pprof) 交互界面要等待一会儿才会出现,而 goroutine,heap,block 则是立马就出现,说明采样在 pprof 命令运行的一瞬间已经完成。
$ go tool pprof  "http://localhost:9090/debug/pprof/profile"
Fetching profile over HTTP from http://localhost:9090/debug/pprof/goroutine

// 等待 30 秒后
Saved profile in .....
File: .......
Type: goroutine
Time: Jul 18, 2021 at 10:07pm (PDT)
Entering interactive mode (type "help" for commands, "o" for options)
(pprof) top
有了这样的假设后,我找准时机,在创建 goroutine 的过程中启动 pprof,果然看到了 1000 个 goroutine